Break Even Analysis
Calculate the Breal-Even Point using this Break-Even Analysis Calculator - by Alex BejanishviliBreak-even analysis is used by businesses to determine the time it will take to become profitable and usually is a part of a Business Plan. Whether you are a startup business, or are thinking of adding a product or service to your existing business venture, it is useful to take the time to run a break-even analysis to determine whether it is a financially viable venture, in terms of how many units you will need to sell to break even, and how long it will take to do so.
The actual calculations required to perform a break-even analysis are relatively simple. The calculations however are the easy part, determining your optimum sales unit price and accompanying variable costs can be much more difficult. Even fixed costs can be less than straightforward, as you may, for example, find yourself with a choice of premises with different rates of rent. While a break-even calculator cannot make these decisions for you, it can make the decision making process significantly easier for you as a business owner, by enabling you to easily look at different scenarios for break-even. Our Break Even Calculator will help you run the reports and analysis you need for your business.
Break Even Analysis
For Excel® 2007+
Bonus Downloads

Break-Even Point Calculator for Multiple Products
This version of Break-Even calculator allows to calculate break-even units and break-even price and break-even period for multiple products using additional Sales Forecast feature. This feature helps to define the proportion of the producUsing Break Even Calculator
There are a number of ways in which break-even can be viewed. While they essentially all use the same information to perform a calculation, there are differences between them, and you may favour one method over the others. Our break-even calculator allows you to work out your break-even number of units, break-even price and break-even payback period. The information you enter can be easily changed, allowing you to easily look at factors such as the impact of a small increase in cost or sale price.
The break-even number of units is the number of units that you would have to sell in order to break-even, or put another way, the point at which your investment will start to make a positive return.
The break-even price is the dollar amount of sales you would have to make in order to cover your costs, i.e. the point at which your total revenue equals your total costs.
The break-even payback period is the amount of time it will take you to break-even.
Our break-even calculator also allows you to calculate a net income before taxes (NIBT) using the monthly number of units sold. This will enable you to see how your business will perform over a period of time, allowing you to plan for the future.
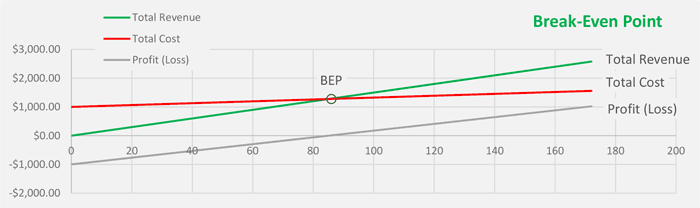
Break Even Chart
A breakeven chart is a useful way of displaying your total revenue, total cost and profit (or loss), along with you're a break-even point. There are two ways of calculating this break-even point:
- TC - Total Costs
- TR - Total Revenue
- FC - Total Fixed Costs
- TR - Total Variable Costs
- P - Sale Price per Unit
- U - Number of Unites Sold
You will find a version of this chart on each of the spreadsheets, with the number of units running along the X axis, and cost/revenue/profit running along the Y axis.
Solving Break Even Analysis Problems
For all break-even calculations, you will need to know the fixed costs, variable costs and sales price per unit.
Solving for number of units
There is a dedicated sheet on the spreadsheet for calculating the break-even number of units. The formula used for this calculation is:
The definition of the variables used in this equation are listed below:
- X - Number of Units to Break-Even
- P - Sale Price per Unit
- FC - Total Fixed Cost
- VC - Total Variable Cost Per Unit
Enter your unit sale price above the chart, and use the areas below it to enter your fixed and variable costs. The fixed costs section should be used for entering costs that do not vary depending on the number of units sold or manufactured, for example rent. The variable costs is split into two sections, one for costs equating to a dollar amount per unit, for example, manufacturing costs, and another for percentage costs per unit, e.g. a licencing fee or commission.
Once you have entered all of this information, the chart will show you your total revenue, total cost and profit (or loss) based on the number of units sold. Below the chart, you will find the number break-even units and break-even sales.
Solving for the Break-Even Price
The next sheet on the spreadsheet calculates the break-even price per unit. This can be useful if you want to try and calculate the price you need to sell a set number of units at in order to break-even. The calculations used for this are:
- P - Sale Price per Unit
- X - Number of Units to Break-Even
- FC - Total Fixed Cost
- VC-P - Total Variable Cost Per Unit Percentage-Based
- VC-D - Total Variable Cost Per Unit Dollar-Based
At the top of the sheet, enter the number of units you are looking to sell. As with the break-even units sheet, enter your fixed and variable costs below the chart in the appropriate sections. Again, the chart will show you your total revenue, total costs and profit (or loss) based on the number of units sold. This time however, the focus is on the unit sale price information. The chart shows the total revenue at which you will break-even, and below the chart, this information is given, along with the break-even sales and number of units (as entered at the top of the sheet).
Solving for the payback period
Unlike the other two break-even calculations, the payback period requires fixed costs and start-up costs to be split, for example, a piece of manufacturing equipment may only need to be purchased once, whereas rent is an ongoing fixed cost.
- T - Payback Period in months
- SC - Total Start-up Costs
- P - Sale Price per Unit
- VC - Total Variable Cost Per Unit
- RFC - Total Recurring Fixed Cost
- x - Number of Units sold per month
Enter your unit sale price and number of monthly number of units at the top of the page. As before, there is space to fill out your recurring fixed and variable costs, and additionally for this spreadsheet, there is a section for entering your start-up costs.
To the right of the data entry section, a chart will again show you the total revenue, total cost, and profit (or loss). Below the chart, you will find all of the information you have input, along with the break-even time and break-even units.
Solving for break-even sales
There are two methods of calculating the break-even sales as a dollar amount.
- S - Break-even sales
- P - Sale Price per Unit
- U - Number of units
- FC - Total Fixed Cost
- VC - Total Variable Cost Per Unit
The second part of this equation (1 - VC / P) is also known at the contribution margin ratio CMR, so the formula can be more simply expressed as:
- S - Break-even sales
- FC - Total Fixed Cost
- CMR - Contribution margin ratio
The break-even sales amount can also be altered to take the payback period into account:
- S - Break-even sales
- P - Sale Price per Unit
- MU - Number of units per month
- T - Payback period in month
Should you require a certain profit level, adding this into your fixed costs will allow you to calculate your break-even sales after taking this into consideration. There are a number of reasons why this could be helpful, for example if you are relying on the profits for your personal income, rather than taking a salary that is already accounted for within the fixed costs.
Net Profit Before Tax
The Break-even (Payback Period) sheet contains a chart and table for the net profit before tax (NPBT). The NPBT is a commonly used measure of profitability, and is sometimes also referred to as earnings before tax, or pre-tax profit. As the name suggests, it is calculated by subtracting expenses, with the exception of corporate income tax, from income
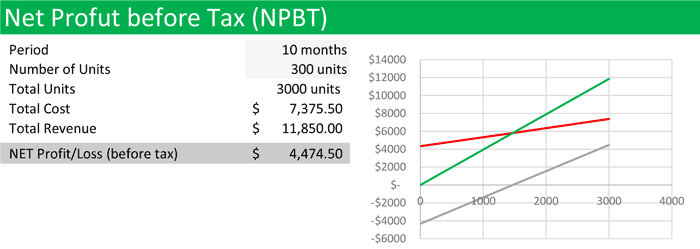
On the spreadsheet itself, the net profit before tax can be calculated by selecting the period (number of months), and number of units you want to calculate for. You may wish to use your solved payback period, or number of units for this calculation, or might prefer to look over a set period of time, for example six months or a year. Using this information, along with the costs and revenue information entered elsewhere on the Break-even (Payback Period) sheet, the NPBT calculator will tell you the total number of units sold, total cost and total revenue, along with a value for the NPBT.